

How diagnostics and investigations work
Diagnostics turn an observed App condition into a customer-visible investigation with evidence and suggested actions.
They are decision support. They don’t replace verification of the running App, and they don’t authorize a change merely because one is suggested.
Detection and investigation are different stages
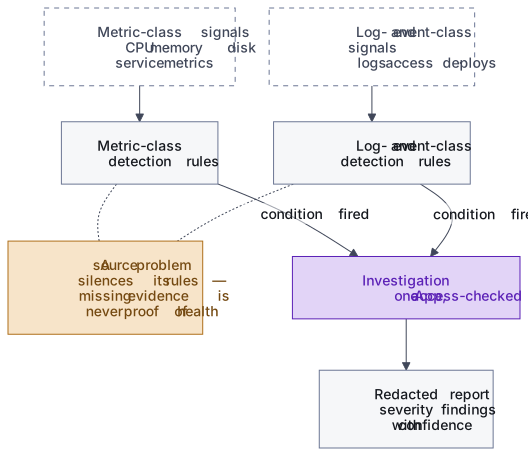
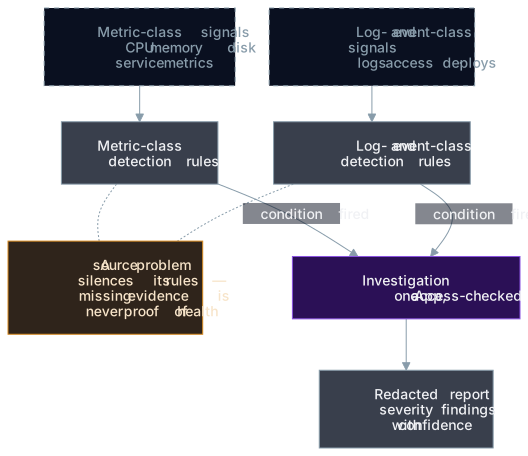
Section titled “Detection and investigation are different stages”A detection rule evaluates a particular signal and decides whether its condition fired. A fired detection creates an investigation record for one App. The investigation then carries the report state, findings, and evidence.
Current portal investigations are created automatically. The portal’s manual request control is currently disabled.
The detection banner and investigation list answer different questions:
- the banner shows recently detected conditions;
- the list preserves the diagnostic history;
- the detail page shows the report captured for one investigation.
- the recent-traces list and waterfall show where one retained request spent time across the instrumented request path.
The banner’s Active label means recently detected, not confirmed still unresolved. The report remains visible after the condition changes.
Deep investigations add code-level analysis
Section titled “Deep investigations add code-level analysis”A deep investigation adds automated code-level root-cause analysis to the same
investigation record. In the API, deep_state is none, running, complete,
or failed, and deep_progress reports numeric progress while the analysis
runs. After a completed analysis passes review, its findings join the other
findings on that investigation.
Different rules use different signal sources
Section titled “Different rules use different signal sources”Metric-class rules evaluate time-series measurements such as CPU, memory, disk, and available service metrics. Log- and event-class rules evaluate application logs, access events, security events, slow-query events, and deploy events.
These sources fail independently. A metrics-source problem can prevent metric-class rules from evaluating while log- and event-class rules continue; a log-source problem can silence those event rules while metric rules continue. The portal must not turn missing evidence into a healthy result.
Some service-specific metric rules remain unavailable until their exporter is present. An empty diagnostics page therefore means only that no customer-visible investigation is available for the App; it isn’t a complete health attestation.
Reports are scoped and redacted
Section titled “Reports are scoped and redacted”Every investigation is scoped to one App and Team access is checked before its report is returned. The customer report passes through the shared redaction layer, which removes designated internal fields before display.
A report contains a summary, an investigation severity, and a list of findings. Per-finding evidence text, suggested actions, and code file references aren’t reliably displayed on the current investigation page. Their absence doesn’t prove that no code or configuration cause exists.
Evidence can come from one source or several. More evidence doesn’t make a finding permanent: timestamps, deploy history, and the code revision still define what the report describes.
Severity and confidence answer different questions
Section titled “Severity and confidence answer different questions”Severity describes the potential operational impact of the investigation. Confidence describes how strongly the available evidence supports a particular finding. The current page can show confidence as a numeric value.
A high-severity investigation can still rest on weakly supported findings. A lower-severity investigation can contain strongly supported findings. Read both fields with the report context rather than using either value as a substitute for review.
No finding, low confidence, missing evidence, or an unavailable signal must remain an uncertain state. None should be interpreted as proof of health.
Reports become historical immediately
Section titled “Reports become historical immediately”An investigation describes the App and evidence window observed during that run. A later deploy, rollback, configuration change, restore, resize, traffic shift, or credential rotation can make its conclusion stale.
When a report or support response includes a code reference, treat it as a navigation aid to the code analyzed at that time. Confirm that the referenced path and lines still match the currently deployed revision before changing code.
The report doesn’t automatically resolve itself after you apply a fix. Verify the customer-visible path and current platform state separately.
Request traces are bounded timing evidence
Section titled “Request traces are bounded timing evidence”A request trace is a 14-day retained timing tree for one selected request. It can show envoy, caddy (including its Coraza module work), optional varnish, nginx, php-fpm, and applicable mysql, mariadb, redis, opensearch, or rabbitmq intervals. The viewer preserves recorded causality and displays asynchronous message links separately; it doesn’t infer parentage from timing.
The recent-traces list identifies each page or API request by its HTTP method and query-free URL path. Static asset requests are omitted from that list. An exact Started range selects the server-side evidence window; searchable Request URL, Services, and Status filters and column sorting apply to loaded pages. The list shows Varnish cache outcome and timing when present. Selecting the request URL opens a detail page whose top card shows the URL once, with the participating services in request-path order. Selecting a service filters the trace to that hop.
A ranked Hotspots panel shows attributable and elapsed time without flattening the trace; its columns sort, and component and operation filters narrow it. Attributable time removes the work of components further down the request path. That is what keeps an inclusive waiting wrapper from being mistaken for service self time. The varnish.backend_fetch interval contains the downstream app work, so it stays visible with its full elapsed app wait but ranks only on the small remainder that is genuinely Varnish. A proxy additionally reports how long it waited on its upstream, and that reported wait is removed too, so a proxy ranks on the work it actually did rather than on the time it spent blocked. A request served directly from disk reports no upstream wait, and none is removed.
Wall-clock that no span claims as its own work is shown as an explicit Unattributed figure rather than being charged to a component that didn’t spend it or dropped from the total. A large Unattributed value means real time was spent in code this trace doesn’t instrument.
Selecting a hotspot opens the same span in the chronological waterfall. This is timing evidence, not an automatic root-cause claim.
The customer viewer exposes only bounded operational fields. Query strings, SQL values, cache keys, message bodies, credentials, request/response bodies, and customer payloads aren’t displayed. A missing span, missing-parent warning, or truncation warning means the timing evidence is incomplete, not that the omitted component took zero time.
Suggested actions aren’t automatic changes
Section titled “Suggested actions aren’t automatic changes”Suggested actions explain what to inspect or change. The report doesn’t mean that synsmarts changed customer code, configuration, data, or purchased resources.
Apply changes through the normal App workflow. Review destructive or state-changing actions against current backups, deploy state, and business impact. Make one narrow change, verify the original symptom, and record the result.
For procedures, see Review diagnostics and Review a diagnostic investigation.