

Review diagnostics
Open an App and select Diagnostics. How diagnostics and investigations work explains detection, investigation state, and confidence behind this page.
Team owners, admins, developers, and billing members can open Diagnostics. Billing members can review request-tracing state but can’t change it or view alerts and investigations.
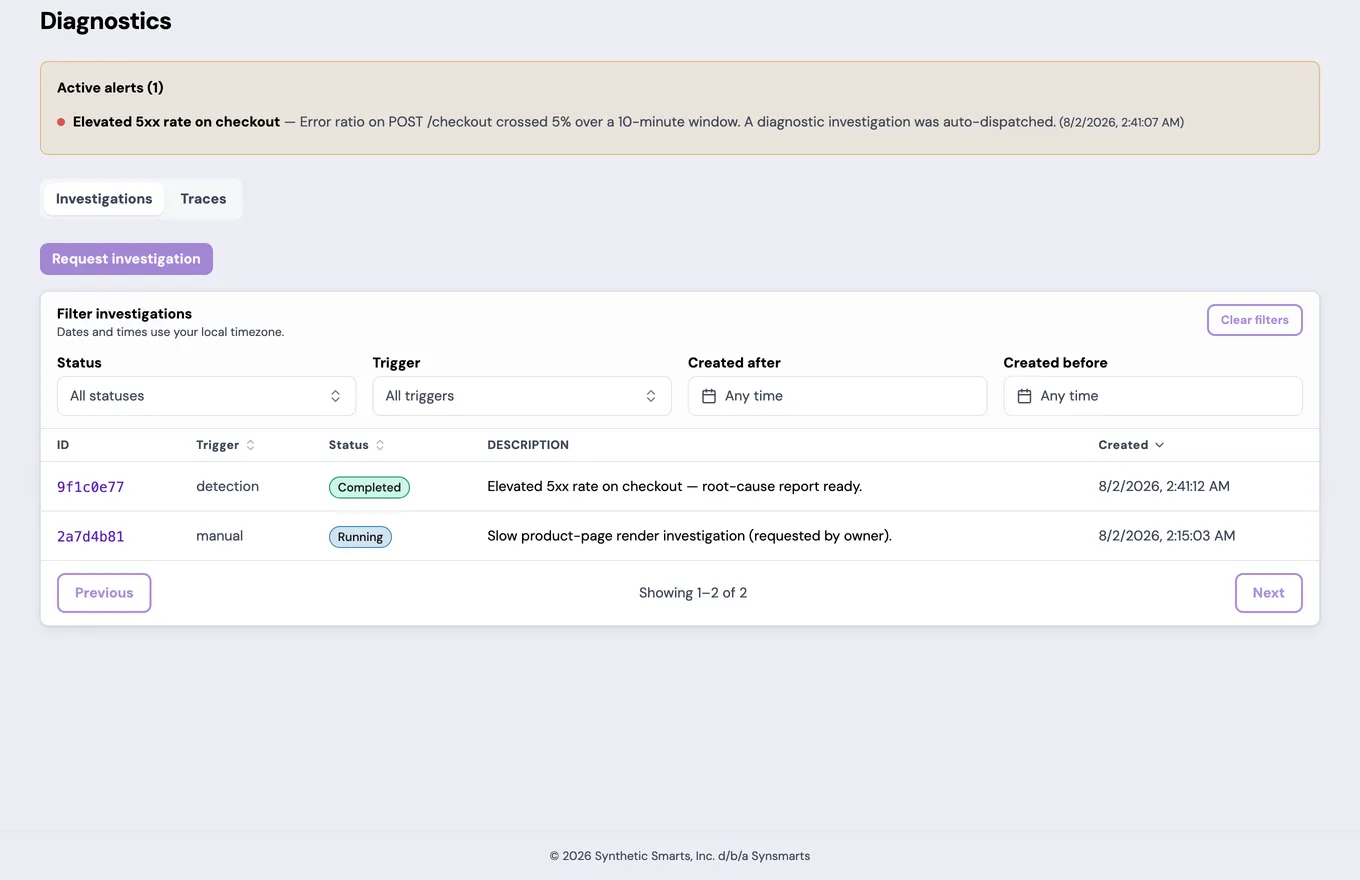
The page shows recent automatic detections and the investigations created for that App. It doesn’t provide a general health check, and an empty page doesn’t prove that every App path is healthy.
Trace a request when you need per-request evidence
Section titled “Trace a request when you need per-request evidence”The Traces view controls request collection and opens each captured request as a connected service waterfall with cache and span timing. Use Trace requests to choose a mode, set PHP code-level detail per runtime, send a triggered request, filter retained traces, and interpret the waterfall safely.
Understand investigation creation
Section titled “Understand investigation creation”synsmarts creates an investigation when an enabled detection rule observes a qualifying metric, log, or event condition for the App.
The Request investigation button is disabled. Its tooltip explains that on-demand investigations aren’t available. Customers can’t start a manual investigation from the portal yet.
Treat the list as a history of diagnostic work, not as a count of every error or threshold crossing.
Read detection alerts carefully
Section titled “Read detection alerts carefully”An alert banner can show recent detections above the investigation list. Alerts appear under Active alerts with a title, short message, and detection time. Severity is represented by a color indicator; open the investigation to read its severity value.
The current Active label means the detection was recent. It doesn’t prove that the condition is still occurring or that the App remains impaired. Confirm the current customer-visible behavior, recent deploys, and current usage before taking action.
The alert area covers detections from the last 24 hours, newest first, up to 50 entries. Older detections remain in the investigation list.
The alert area can be empty when there are no recent detections, when a signal-source problem prevents a class of rules from evaluating, or when the portal couldn’t load alert data. The portal doesn’t show an alert-loading error, so absence of an alert is never an all-clear.
Read the investigation list
Section titled “Read the investigation list”The newest investigations appear first. The table shows:
- the first eight characters of the investigation identifier;
- the trigger type;
- status;
- description;
- creation time.
The page shows 20 investigations at a time. Use Previous and Next to move through the App’s history.
| Status | Meaning |
|---|---|
| In progress | The investigation has started but isn’t complete. |
| Running | Diagnostic work is still executing. |
| Completed | Processing ended; review the report and its evidence window. |
| Failed | Processing ended without a completed result. |
| Unknown | The investigation was returned without a status value. |
A completed investigation can have no findings. That means the report contains no customer-visible finding; it isn’t a guarantee that the App has no problem.
A status the portal doesn’t recognize is displayed exactly as the platform reported it. Treat an unfamiliar status as unresolved and include it in a support request.
Open the relevant report
Section titled “Open the relevant report”Select the short identifier. Match the investigation’s creation time and description to the incident or behavior you are reviewing.
Read the summary first, then compare severity and findings with:
- the incident start and last-known-good times;
- deploys or configuration changes near the detection;
- the current App behavior;
- the current Usage page.
A completed report is a historical record. It doesn’t update after a deploy, configuration change, resize, rollback, or recovery.
Handle page and investigation failures
Section titled “Handle page and investigation failures”Failed to load investigations means the portal couldn’t read the list. Select Retry; it doesn’t mean an investigation itself failed.
Something went wrong means the diagnostics view failed to render. Select Try again. If it repeats, include the displayed error ID in your support request.
A Failed investigation is a terminal diagnostic result. Open a support request and include the investigation identifier, App ID, incident time and time zone, customer impact, any related deploy identifier, and any displayed error ID.
Never include passwords, private keys, API tokens, raw secret values, payment data, or unredacted customer records.
For the report review and safe remediation sequence, see Review a diagnostic investigation. For an active outage, use Respond to an App incident. For other failures, get support.