

Trace requests
A request trace shows one page or API request as a connected waterfall across the participating services recorded for that request. It gives you the cache outcome, end-to-end and per-span timings, attributable hotspots, and the recorded parent/child or asynchronous relationships behind that request.
Open an App, select Diagnostics, then select Traces.
Team owners, admins, and developers can change tracing mode, roll the trigger token, and inspect trace data. Billing members can review the current mode but can’t change it, view the trigger token, or open traces.
Choose a tracing mode
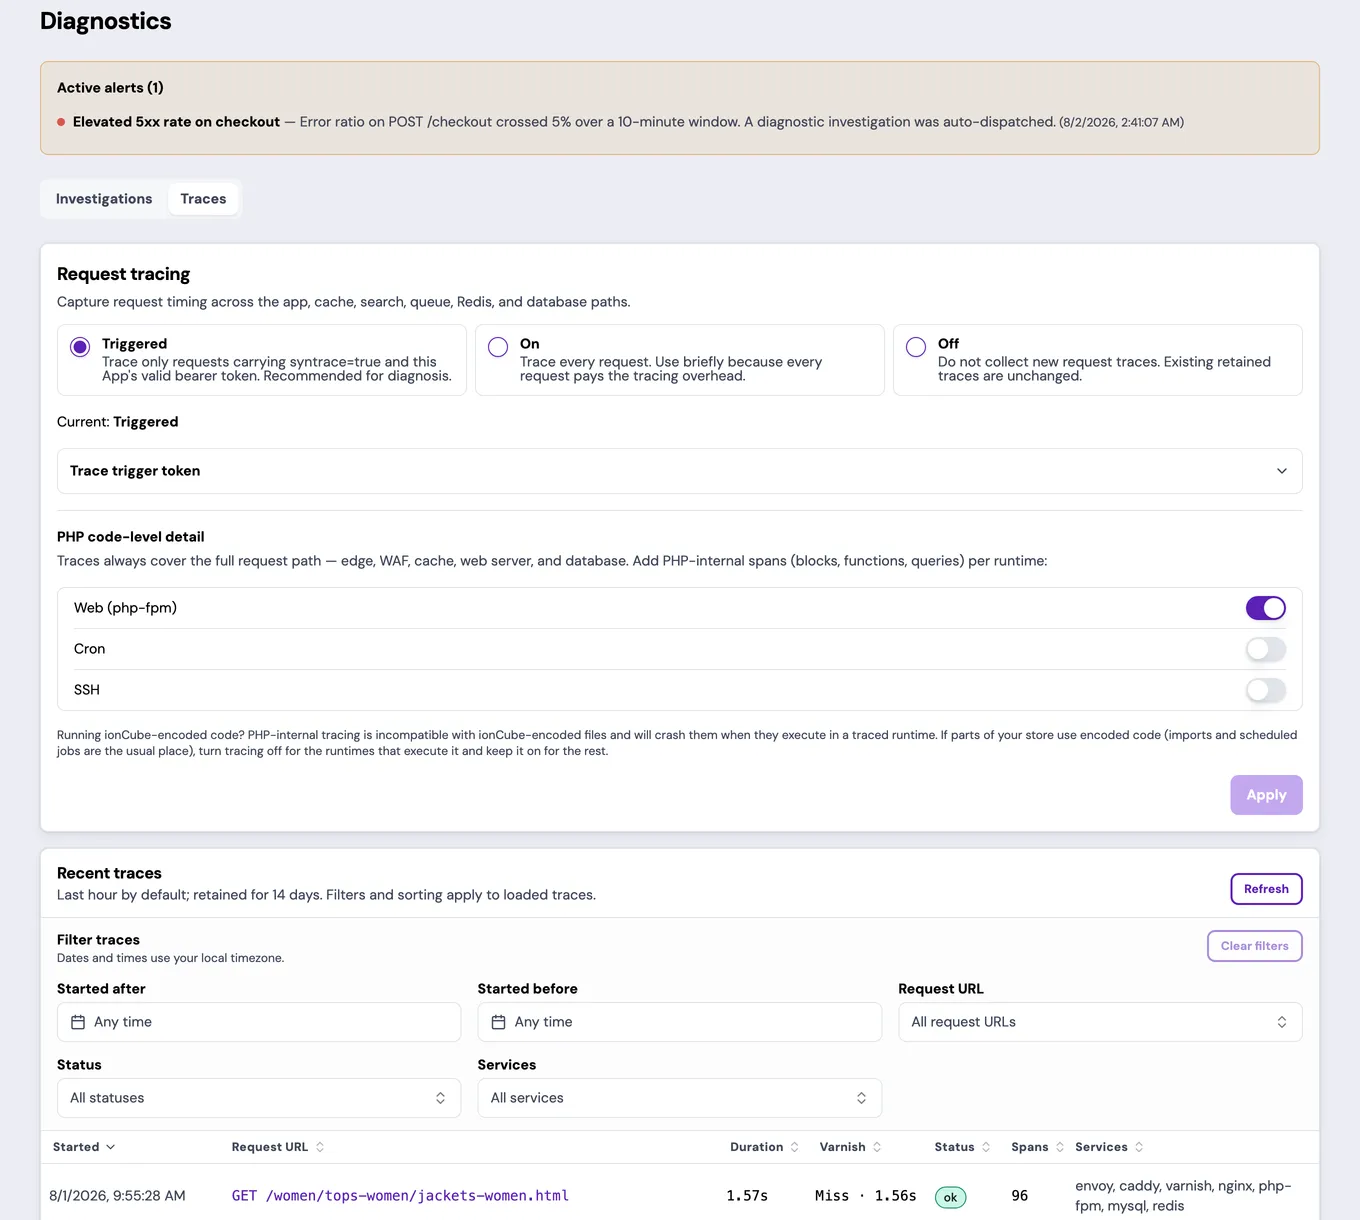
Section titled “Choose a tracing mode”The Request tracing card shows the App’s current mode and whether a change is still applying. Triggered mode is the default.
- Triggered traces only a request sent with
syntrace=trueand the App’s current bearer token. - On traces every request. Use it only during active diagnosis.
- Off creates no new request traces.
A traced request collects its complete span tree; spans aren’t sampled away. On mode adds substantial instrumentation work. Its measured added latency is 103 ms median and 144 ms p99. Off reduces request-level evidence. Existing traces, application and audit logs, security events, and operational metrics remain unchanged.
Add PHP code-level detail per runtime
Section titled “Add PHP code-level detail per runtime”Traces always cover the full request path — edge, WAF, cache, web server, and database. The PHP code-level detail section under the mode control adds PHP-internal spans (blocks, functions, queries) per runtime: Web, Cron, and SSH. All three default on. Turning a runtime off keeps request-path tracing intact and removes only the inside-PHP layer for code running there; applying a runtime change restarts that runtime’s container. Web spans follow the tracing mode, including Triggered requests. Cron and SSH executions have no request to trigger, so their spans are collected only while the mode is On. Changing the mode therefore restarts the Cron and SSH containers, along with any scheduled jobs or shell sessions running in them. The web container isn’t restarted by a mode change.
Running ionCube-encoded code? PHP-internal tracing is incompatible with ionCube-encoded files and will crash them when they execute in a traced runtime. If parts of your store use encoded code (imports and scheduled jobs are the usual place), turn tracing off for the runtimes that execute it and keep it on for the rest.
Apply a mode change
Section titled “Apply a mode change”- Select Triggered, On, or Off.
- Select Apply, then confirm the change.
- Keep the page open through Saving changes… and Saved — applying your changes…. The selection isn’t saved before Apply, and the new mode isn’t ready until Applying clears.
The App stays online while the change applies. Every applied change appears in Team Activity.
If another App setting changed after the page loaded, reload the latest state and try again rather than overwriting the newer configuration.
Send a request in Triggered mode
Section titled “Send a request in Triggered mode”- Expand Trace trigger token.
- Use the displayed token as an
Authorization: Bearerheader. - Add
syntrace=trueto the request URL. - Send the exact customer path you need to diagnose.
Keep the bearer in the authorization header, not in the URL. One token is active per App until it is rolled or tracing leaves Triggered mode.
Roll the trigger token
Section titled “Roll the trigger token”Roll the token after it has been shared more widely than intended or whenever you need to replace the current App credential.
Rolling immediately replaces the token displayed in the portal. The replacement isn’t ready to use, and the old token isn’t revoked, until Applying clears. Keep the page open through that state before sending a request with the replacement.
Find the captured request
Section titled “Find the captured request”Owners, admins, and developers can use Recent traces to inspect requests collected during the selected time range, which covers the last hour by default. The list shows each page or API request as its HTTP method and query-free URL path, together with start time, total duration, status, span count, and participating services. When Varnish participated, the row also shows its cache result and request time.
Static files such as scripts, styles, images, and fonts don’t appear in the list. Older traces collected before URL-path capture can show a normalized route or operation instead.
- Use Started after and Started before to select an exact retained window.
- Narrow the loaded rows with the searchable Request URL, Status, and Services filters.
- Sort any column to compare the traces already loaded.
- Select Load more to add an older page to that working set.
- Select the request URL to open its trace.
Traces are retained for 14 days. Changing tracing to Off prevents new request traces but doesn’t remove retained traces. An empty list means no retained trace matched the App and time range; it isn’t proof that no requests or failures occurred.
Read the trace detail
Section titled “Read the trace detail”The detail page repeats the selected request URL and trace ID, then shows the
cache outcome, end-to-end duration, span count, and participating services in
request-path order. Service names use envoy, caddy, varnish, nginx,
php-fpm, mysql, mariadb, redis, opensearch, and rabbitmq when those
components participated. waf.evaluate identifies Coraza module work inside
caddy rather than a separate service.
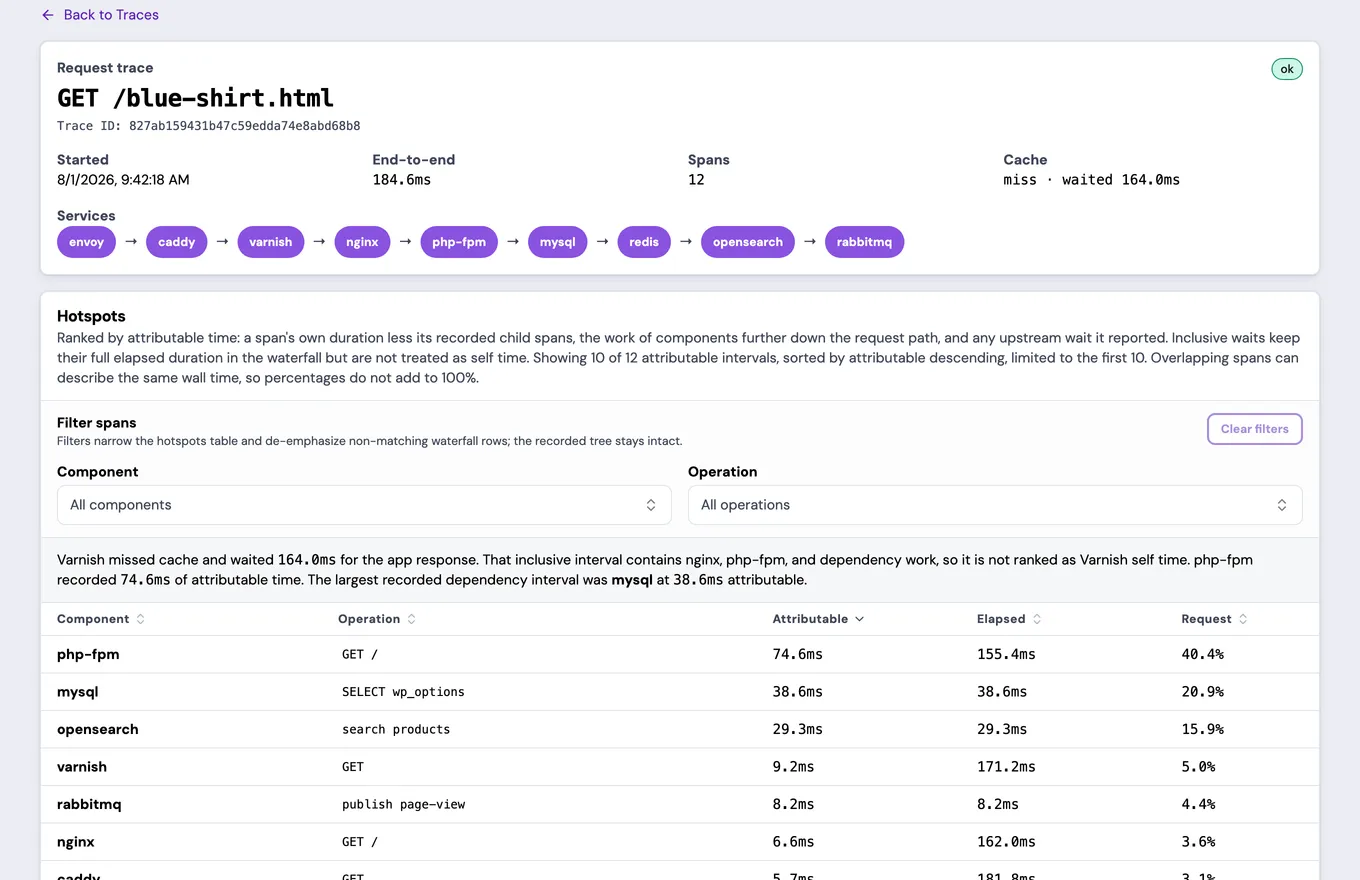
Use the service pills to focus the analysis without changing the recorded tree. The Hotspots panel ranks attributable intervals and also shows each span’s elapsed duration and share of the request. Use it to find where to start, then select a hotspot to see the same span in the waterfall.
Attributable time subtracts work performed by components further down the
request path. An inclusive downstream wait such as varnish.backend_fetch
keeps its full elapsed duration, but it ranks on the smaller remainder that is
genuinely Varnish, not on the nginx and php-fpm time spent waiting. A proxy’s
reported wait on its upstream is subtracted the same way, so the proxy ranks
on what it did rather than how long it was blocked. A request served from disk
reports no wait and keeps its full duration.
Time that no span claims appears as Unattributed. It represents time spent in code the trace doesn’t instrument. The waterfall follows recorded parent/child relationships and stays in time order. RabbitMQ links are asynchronous relationships, not ordinary parent edges. The viewer doesn’t invent a FastCGI span or reparent spans based on timestamps.
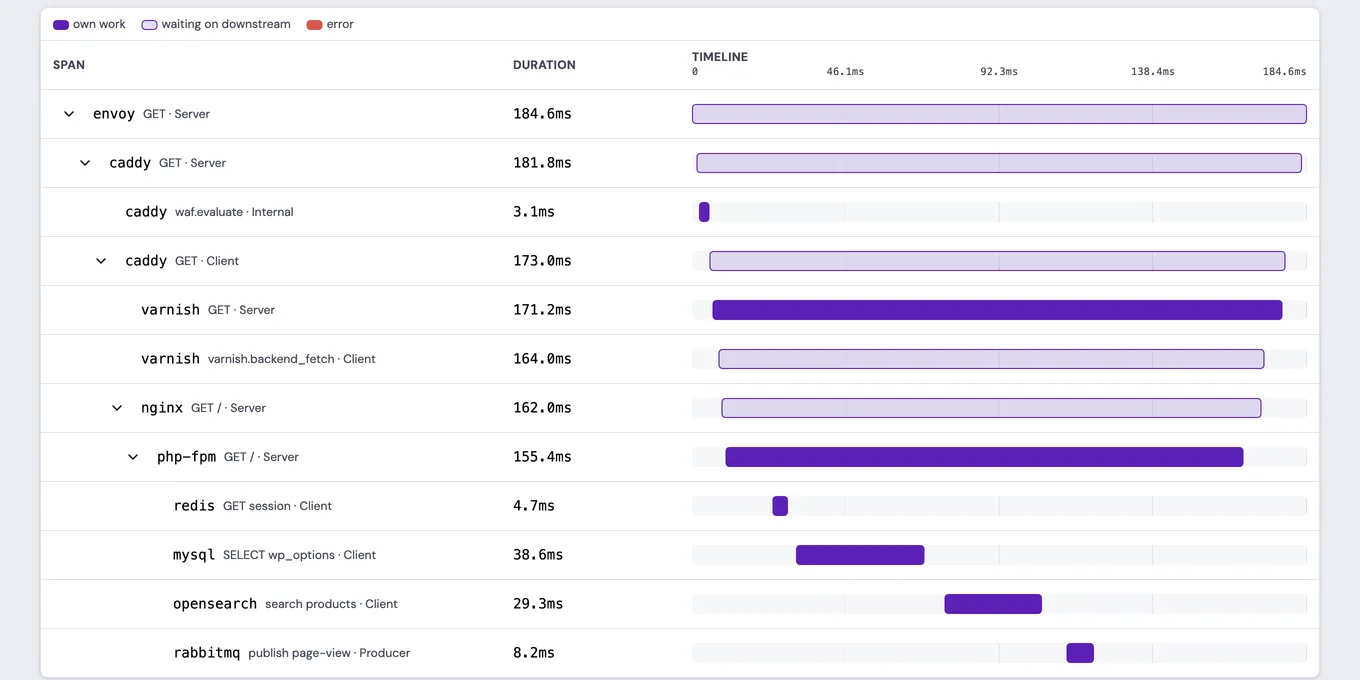
On a complete trace, a cache hit correctly stops before nginx and php-fpm. An incomplete-tree warning means absence can’t prove bypass. A truncation or missing-parent warning also means the visible tree is incomplete; don’t treat the gap as idle time or a healthy dependency.
Review customer-safe span output
Section titled “Review customer-safe span output”Select a span to review its exact duration, status, and safe bounded attributes. The visible URL never includes its query string or fragment. The viewer intentionally omits SQL values, Redis keys, OpenSearch bodies, authorization data, request and response bodies, and customer payloads.
Review the visible paths and span attributes before sharing a capture, the same way you would any operational record. Use the trace ID for correlation when you contact support. Keep passwords, private keys, API tokens, raw secret values, payment data, and unredacted customer records out of support requests and shared notes.